Slippers & Statistics.
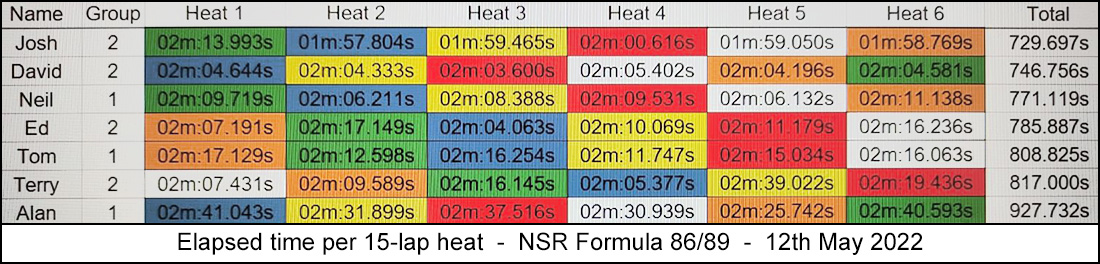
Despite a meagre turnout of just seven drivers, this week’s F1 event produced some great racing. Josh took the win, but behind him David, Neil, Ed and Terry were barely separable on pace, the final result decided more by a driver’s consistency and fondness for crashing than anything else, with even Josh languishing in the midfield for the first couple of heats until he got his act together and pulled out an unassailable lead.
With Neil winning a spot on the podium for only his second time this year, Terry winning the dubious honour of the night’s least consistent driver and Alan dominating the ‘Least Grippy Tyres’ category, it was good to see the prizes being shared around.
However, the evening’s undoubted highlight was a new competition introduced for this week only – ‘Most Stylish Footwear’ – which was an easy win for Ed, who’d turned up wearing his slippers. Whether they were intended as a driver aid to make him feel more relaxed, or merely the first sign of impending dementia, he didn’t say.
As a special treat this week for those who like this sort of stuff, you get some new statistics, this time trying to illustrate how consistent a driver’s lap times are.
For each race this year a ‘Consistency Score’ has been calculated, which is a driver’s fastest lap expressed as a percentage of his average lap. For example, if his fastest race lap is 9.500 seconds and his average lap 10.000, then his consistency score is 95%
Make of them what you will. Clearly crashes add time to a lap and hence affect the race average, so the consistency score reflects not only the ability of a driver to repeatedly lap close to his fastest lap, but also how prone he is to crashing. DNFs and individual race scores lower than 80% have been discarded so as not to skew the overall score.
If you’re peering at this on a tiny smartphone screen, click the button below to see detailed scores for individual races, although bear in mind that you’ll need either a magnifying glass or to do a lot of scrolling.
The stats are just a bit of fun, so don’t read too much into them. If your score is 99.99% but you can’t lap faster than 12 seconds when everyone else is doing 8s, you’re still, bluntly, rubbish, just unusually consistent at being rubbish. All that really matters is who crosses the finish line first, but given that professional racing drivers spend hours poring over stats, graphs and telemetry data, it’s about time that Molesey’s drivers had something similar with which to confuse themselves!